Vibrometry section
Vibrometry section
Vibrometry panel
Ss a module developed by Field srl for the analysis and verification of vibrometric data in accordance with the UNI9916 standard
The module allows the user the online visualization of data from all dynamic devices installed on site, both of the event time histories, both of the data statistical review (min / max / mean).
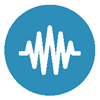
Min, Max, Mean
The 'Min, Max, Mean' window allows you to check the succession of events over time using the following functions:
- visualization of the maximum, minimum and average values recorded by the devices in the 3 directions;
- choice of the time interval of interest.
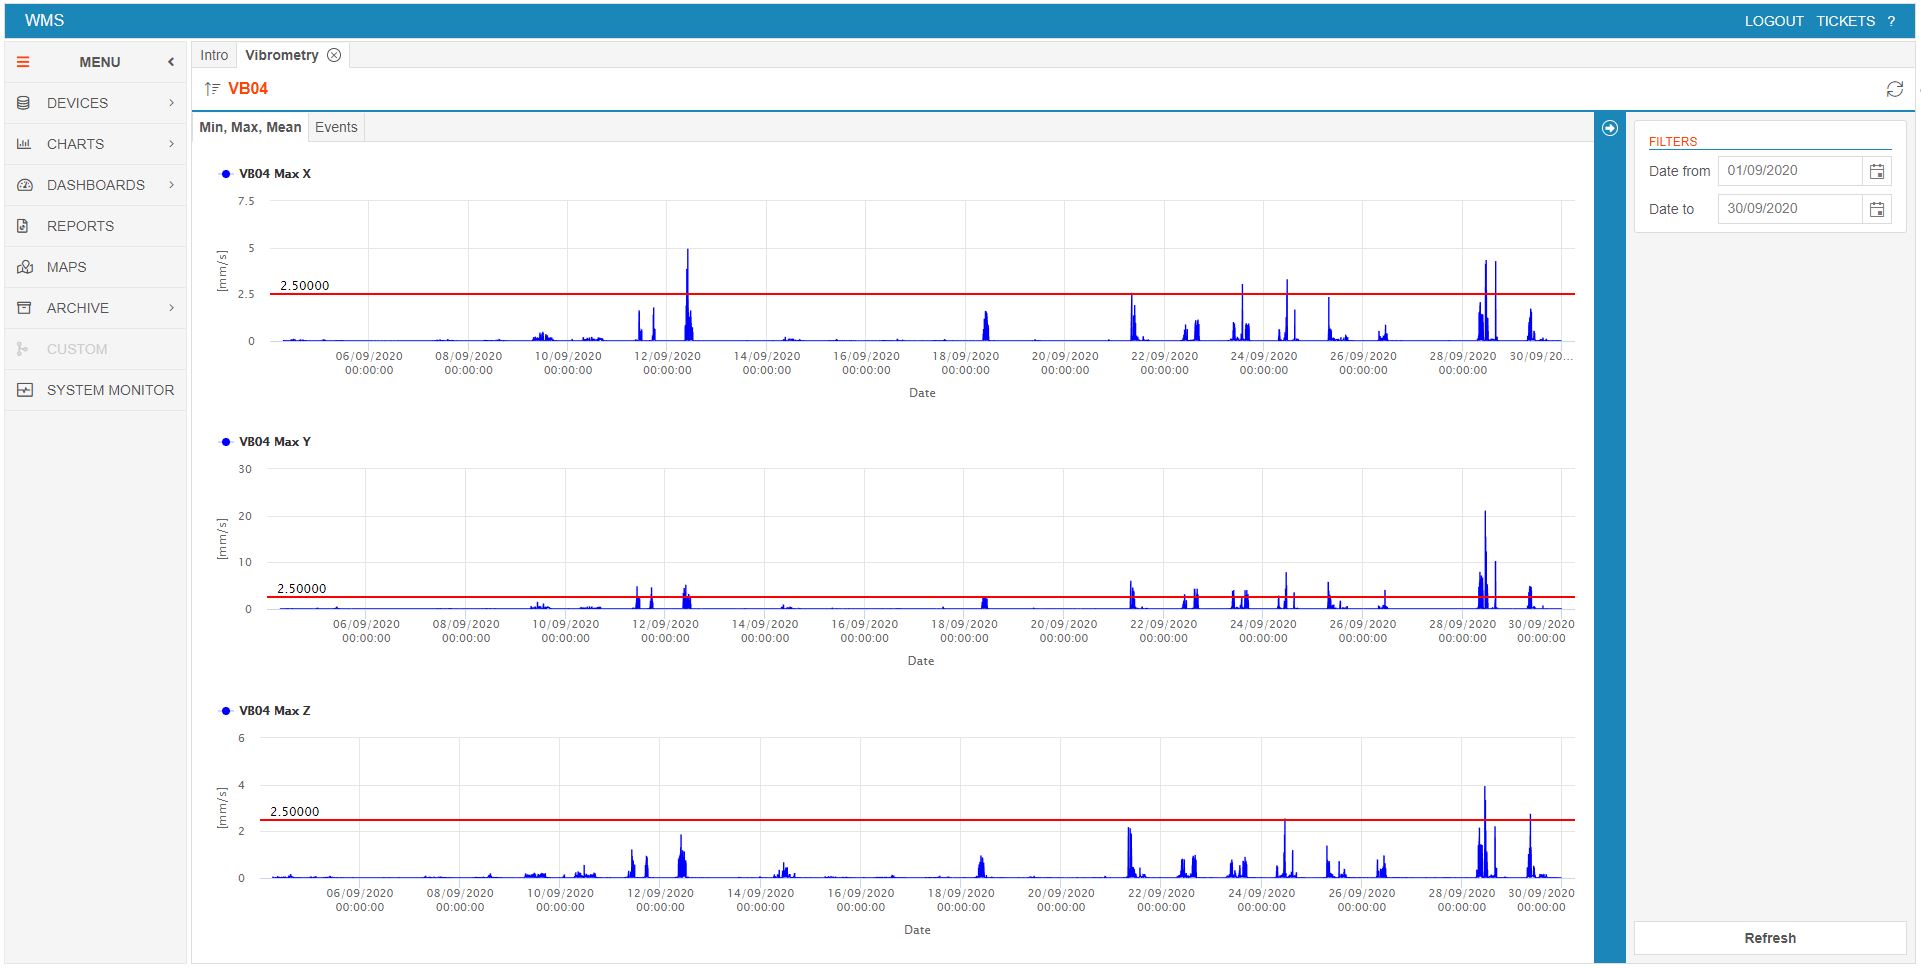
Events
The 'Events' window allows the user to view and manipulate all events whose intensity has exceeded the pre-set thresholds. Here it is also possible to keep under control the 'potential hazard' events in which the intensity - dominant frequency relationship exceeds the vibrational thresholds limit of the reference standards (UNI 9916 standard). Below are the main functionalities:
- visualization of the temporal history of all events whose intensity generated vibrations beyond the threshold;
- choice of the time interval of interest;
- 'dangerous' events (in which the intensity - dominant frequency relationship exceeds the limit vibrational thresholds) highlighted in red;
- visualization in tabular form of the dominant frequency of the signal (Hz) and of the peak value in velocity (PCPV: Pick Component Particle Velocity) in the three directions of space;
- UNI 9916 limits verification chart (or other threshold values previously agreed with the user);
- possibility of selecting, viewing and manipulating a single event through the 'Spectral Analysis' window;
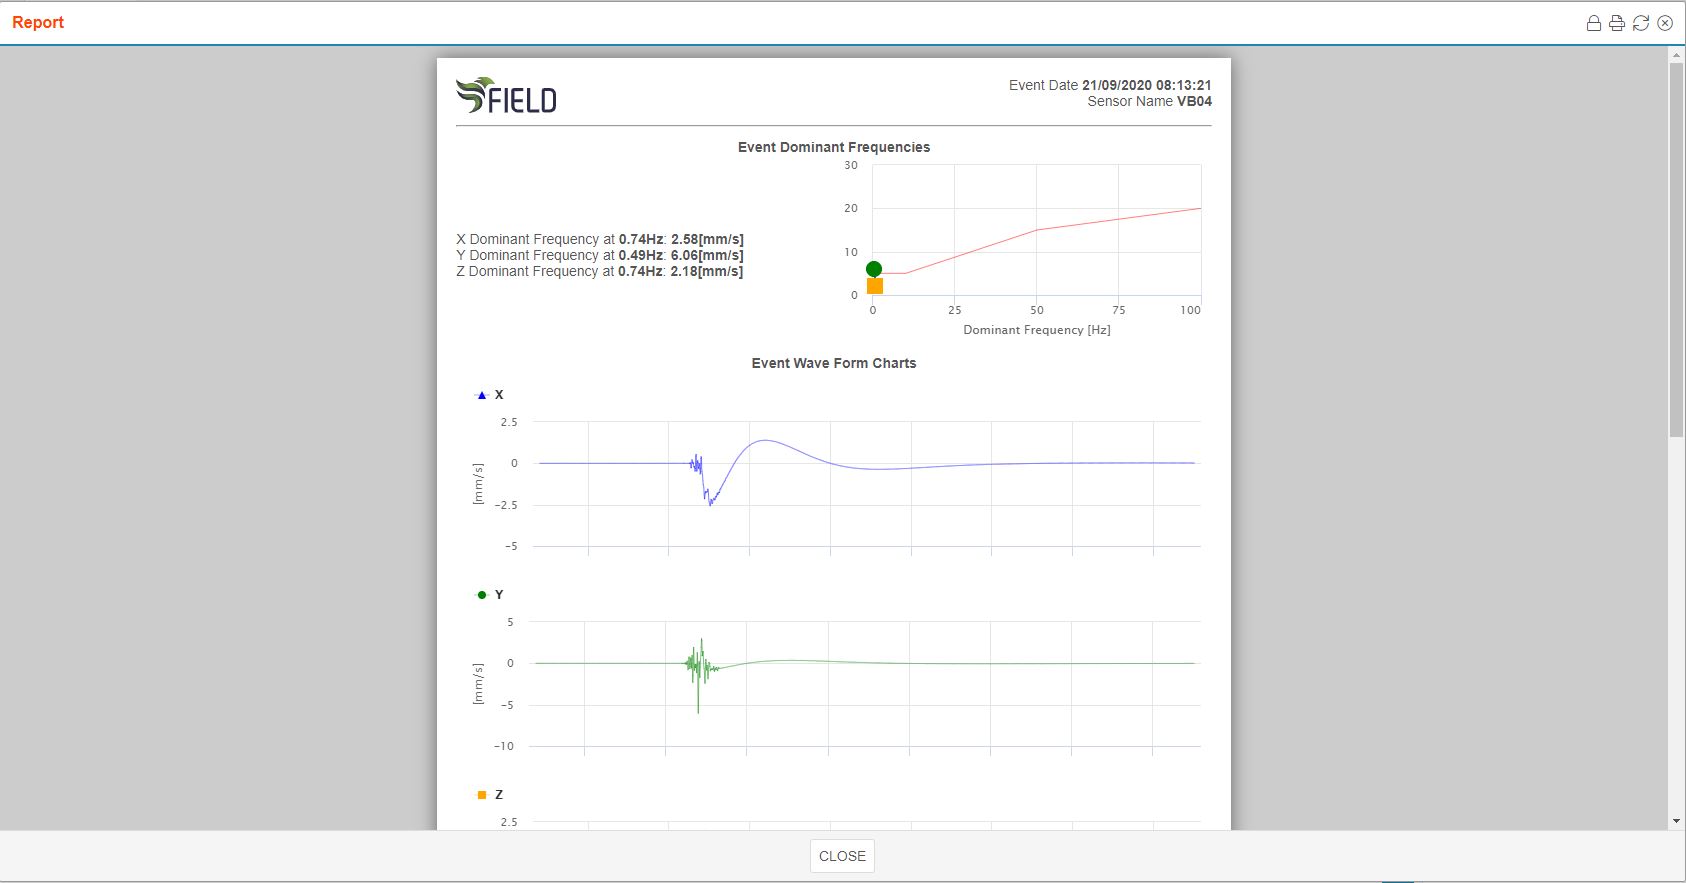
- creation of standard event reports.
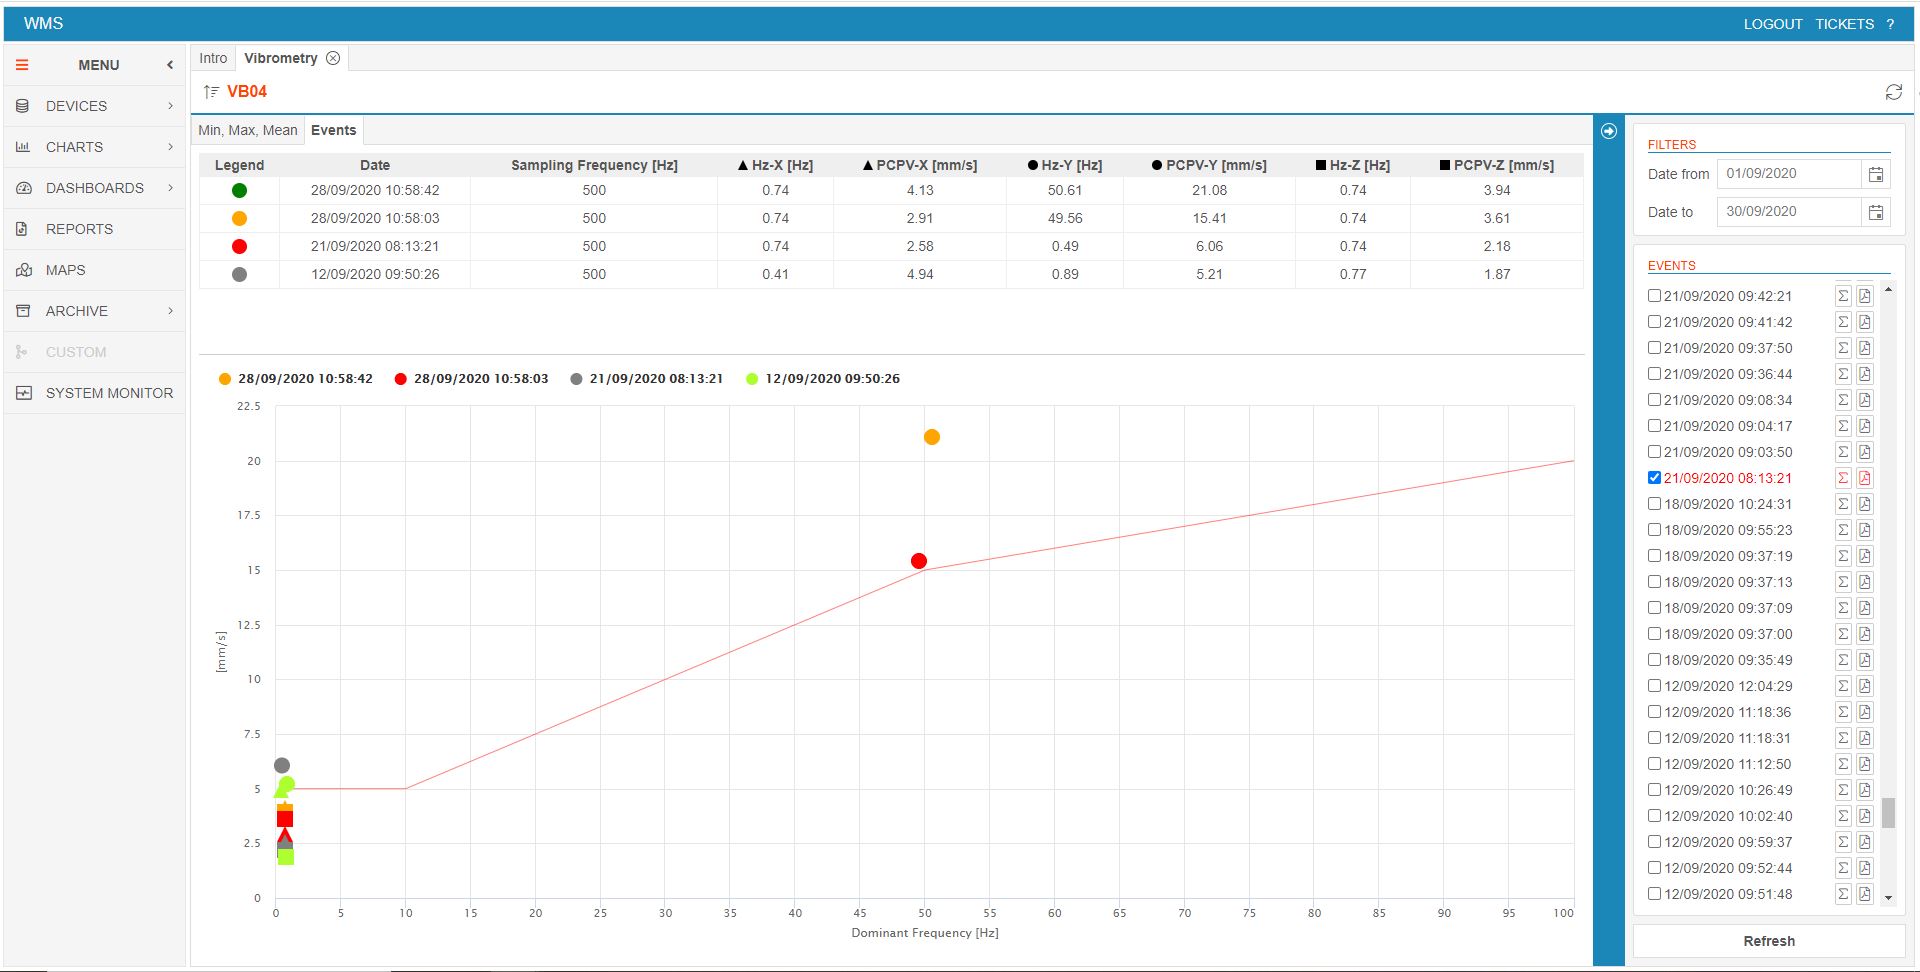
Spectral Analysis
Each event displayed in ‘Events’ can be viewed, analyzed and processed through the 'Spectral Analysis' window which gives access to the following functionalities:
- visualization of the event time history chart;
- visualization of the event frequency content chart;
- possibility of applying high-pass, low-pass, bandpass filters (cut-off frequencies can be set by the user);
- possibility of applying time windows (Hann or Hamming);
- visualization of the UNI 9916 limits verification chart (or other agreed threshold values) following the application of the previous spectral analysis parameters to the event.